Compare a weaker thermal connection
A conductive link changes where heat goes and which events occur. This example reduces the link between two thermal masses from 2 to 0.1 W/K while preserving the heat pulse, ambient losses and trigger rule. You will compare the temperature histories, inspect the inactive neighboring trigger and account for the heat retained and lost by the pair.
The complete model is tr-reduced-coupling, reference version 1, with 48 prepared blocks and 64 connections. It runs in Lemonergy's Rust/WebAssembly engine. Read triggered heat propagation first to understand the otherwise identical stronger-link case.
Open the prepared model
Open prepared examples and choose Two cells: reduced thermal coupling. The complete supplied model loads automatically. Choose Run prepared model to calculate a fresh result with Rust/WebAssembly, then select blocks to inspect their read-only parameters and connections. You can download the original model data for reference.
The public viewer lets you inspect, run and explore this prepared example. To change parameters, connect blocks, import a file or save an edited model, choose Edit with Pro. The Design app opens the selected example in its authenticated Pro editor; the workflow guide explains both experiences.
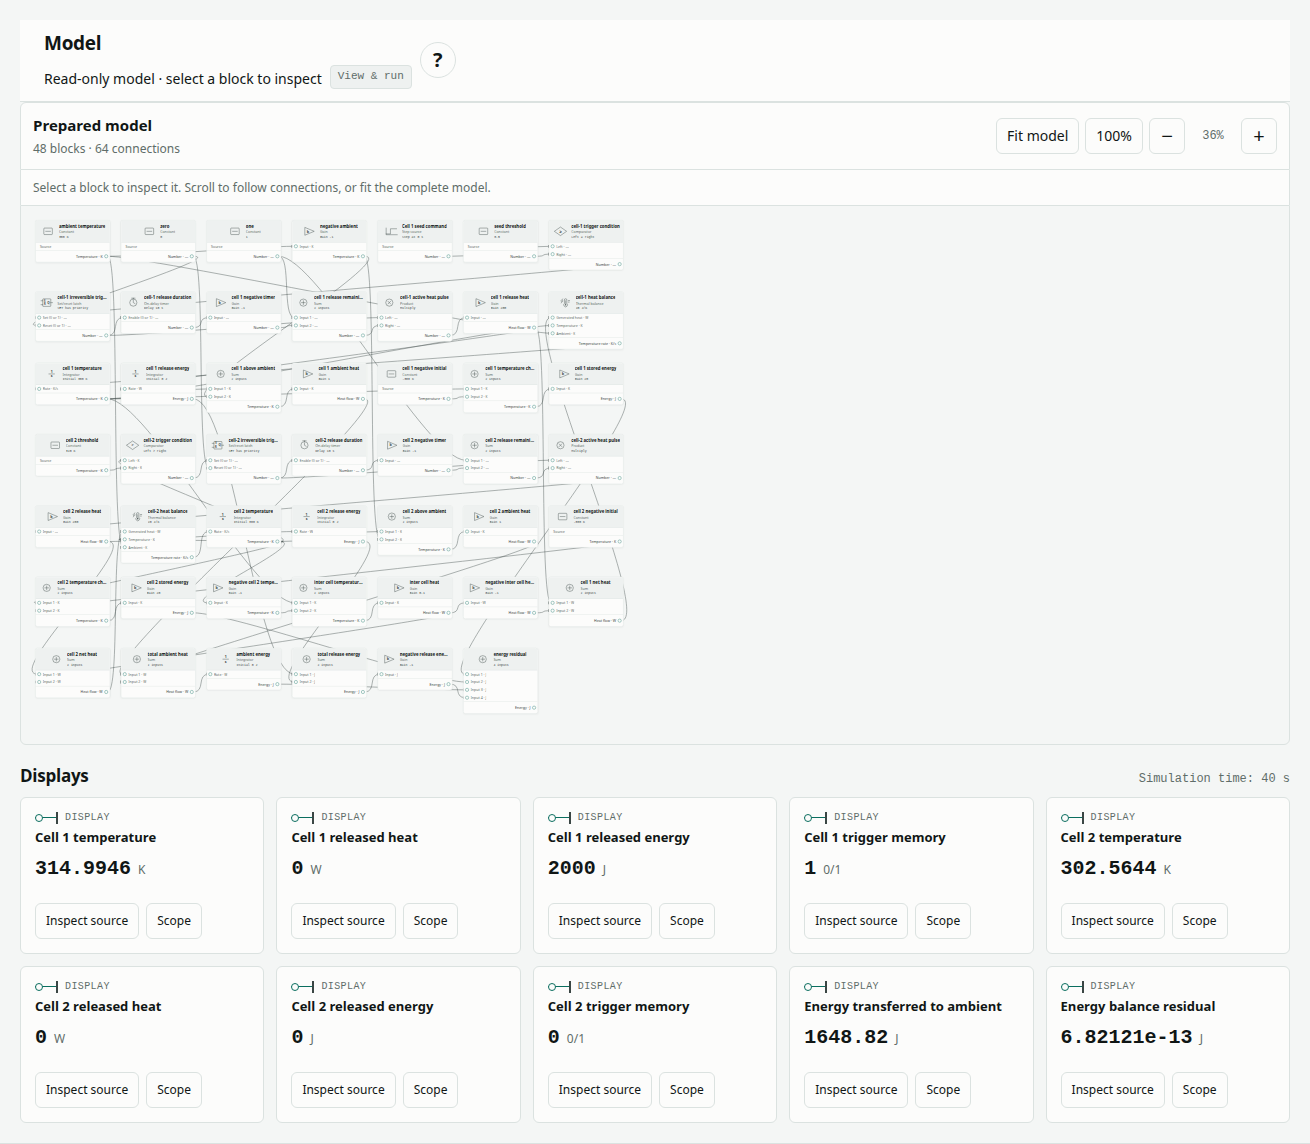
The neighboring latch, timer and release branch remain present. No missing block is needed to obtain the absence of a second pulse: the modeled neighboring temperature simply does not satisfy its trigger condition during the observation window.
Set up the controlled comparison
For each cell, heat release and inter-cell conduction compete with heat loss to ambient:
q12 = G (T1 − T2)
C dT1/dt = P1 − H (T1 − Ta) − q12
C dT2/dt = P2 − H (T2 − Ta) + q12
P1 = 200 W for 0 ≤ t < 10 s; otherwise 0 W
P2 = 200 W for ten seconds if a sampled T2 > 320 K trigger occurs
Cell 1 is time-seeded at 0 s. Cell 2 tests its temperature every 0.1 s with a strict greater-than comparison. A trigger latches once; a timer controls its finite release duration.
| Input | This example | Stronger-link example |
|---|---|---|
| Inter-cell conductance G | 0.1 W/K | 2 W/K |
| Heat capacity C | 20 J/K per cell | Same |
| Initial temperatures | 300 K, 300 K | Same |
| Ambient conductance H | 1 W/K per cell | Same |
| Ambient temperature Ta | 300 K | Same |
| Release power and duration | 200 W for 10 s per triggered cell | Same |
| Cell 1 seed | 0 s | Same |
| Cell 2 threshold | T2 > 320 K | Same |
| Logic sample interval | 0.1 s | Same |
| Observation window | 0–40 s | Same |
The reference evolves mean and difference temperatures analytically between sample instants. With m = (T1 + T2)/2 − Ta and d = (T1 − T2)/2, the decay rates are H/C = 0.05 s⁻¹ for m and (H + 2G)/C = 0.06 s⁻¹ for d. The smaller link lets the temperature difference persist longer. See passive heat exchange for the same mean/difference method without heat release or ambient loss.
Inspect the complete block inventory
Select a block in the prepared diagram to inspect its read-only parameters and connections. In the table, cell-i denotes the corresponding group on each cell.
| Block or group | Parameters and units | Function |
|---|---|---|
ambient-temperature, zero, one · Constants | 300 K, 0, 1 | Supply environment and logic levels |
negative-ambient · Gain | −1 | Provide −Ta to the ambient-difference sums |
cell-1-seed · Step; seed-threshold · Constant | Before 0, after 1, at 0 s; threshold 0.5 | Issue the seed command |
cell-1-trigger · Compare | Seed ≥ 0.5 | Set cell 1 trigger |
cell-2-threshold · Constant; cell-2-trigger · Compare | 320 K; T2 > threshold | Test neighboring temperature |
cell-i-latched · Boolean latch | Sample 0.1 s; initial 0; reset zero | Keep trigger memory |
cell-i-release-complete · On-delay timer | Sample 0.1 s; delay 10 s | End release after a trigger |
cell-i-negative-timer · Gain; cell-i-release-remaining · Sum | −1; two inputs | Form 1 − timer output |
cell-i-release-gate · Product | Latch × release-remaining; scale 1 | Gate the pulse |
cell-i-release-heat · Gain | 200 W per unit logic level | Supply released heat |
cell-i-temperature-rate · Thermal balance | C = 20 J/K; H = 1 W/K | Calculate temperature rate |
cell-i-temperature · Integrator | Initial 300 K; gain 1 | Accumulate temperature |
cell-i-release-energy · Integrator | Initial 0 J; gain 1 | Accumulate released energy |
cell-i-above-ambient · Sum; cell-i-ambient-heat · Gain | Ti − Ta; gain 1 W/K | Measure ambient heat loss |
cell-i-negative-initial · Constant; cell-i-temperature-change · Sum | −300 K; two inputs | Form temperature change from initial state |
cell-i-stored-energy · Gain | 20 J/K | Calculate stored-energy increase |
negative-cell-2-temperature · Gain; inter-cell-temperature-difference · Sum | −1; two inputs | Form T1 − T2 |
inter-cell-heat · Gain; negative-inter-cell-heat · Gain | 0.1 W/K; −1 | Apply equal and opposite conduction |
cell-1-net-heat, cell-2-net-heat · Sums | P1 − q12; P2 + q12 | Feed the Thermal balance heat ports |
total-ambient-heat · Sum; ambient-energy · Integrator | Two inputs; initial 0 J, gain 1 | Accumulate environmental heat transfer |
total-release-energy · Sum; negative-release-energy · Gain | Two inputs; −1 | Form the negative release total |
energy-residual · Sum | Four inputs | Check stored change + ambient transfer − release |
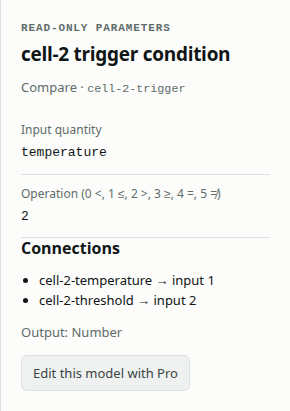
The Gain on inter-cell-heat is the controlled difference between the two cases. Keep both ambient conductances and both heat capacities unchanged for a meaningful comparison.
Run and inspect the inactive trigger
- Confirm the loaded binding contains 48 blocks, 64 connections and the 0–40 s window.
- Keep the solver contract below and the 0.1 s sample times on the latches and timers.
- Choose Run prepared model. Check that the comparison and full-trace completeness pass.
- In Scope signal, choose Cell 2 temperature. Inspect its entire trace, not only the final value.
- Choose Cell 2 trigger memory, Cell 2 released heat and Cell 2 released energy in turn. They remain zero throughout this case.
- Inspect Cell 1 temperature, Cell 1 released heat and Cell 1 released energy. Its pulse ends at 10 s and contributes 2,000 J.
- Inspect Energy transferred to ambient and Energy balance residual. Choose Download results CSV for the sampled rows or Download run evidence for the full verification.
| Solver setting | Reference value |
|---|---|
| Method | Dormand–Prince 4(5) |
| Initial / minimum / maximum step | 0.001 / 1e−10 / 0.1 s |
| Relative / absolute tolerance | 1e−11 / 1e−12 |
| Maximum steps | 100,000 |
| Algebraic tolerance / iteration limit | 1e−10 / 30 |
| Implicit tolerance / iteration limit | 1e−10 / 20 |
After the run, move Display time to inspect numerical Display outputs at retained solver times. Choose a signal’s Scope button, or use Scope signal, to view its full trajectory and reference-error plot. Scrubbing changes the inspected time, not the prepared model or its result.
Interpret the temperatures and energy
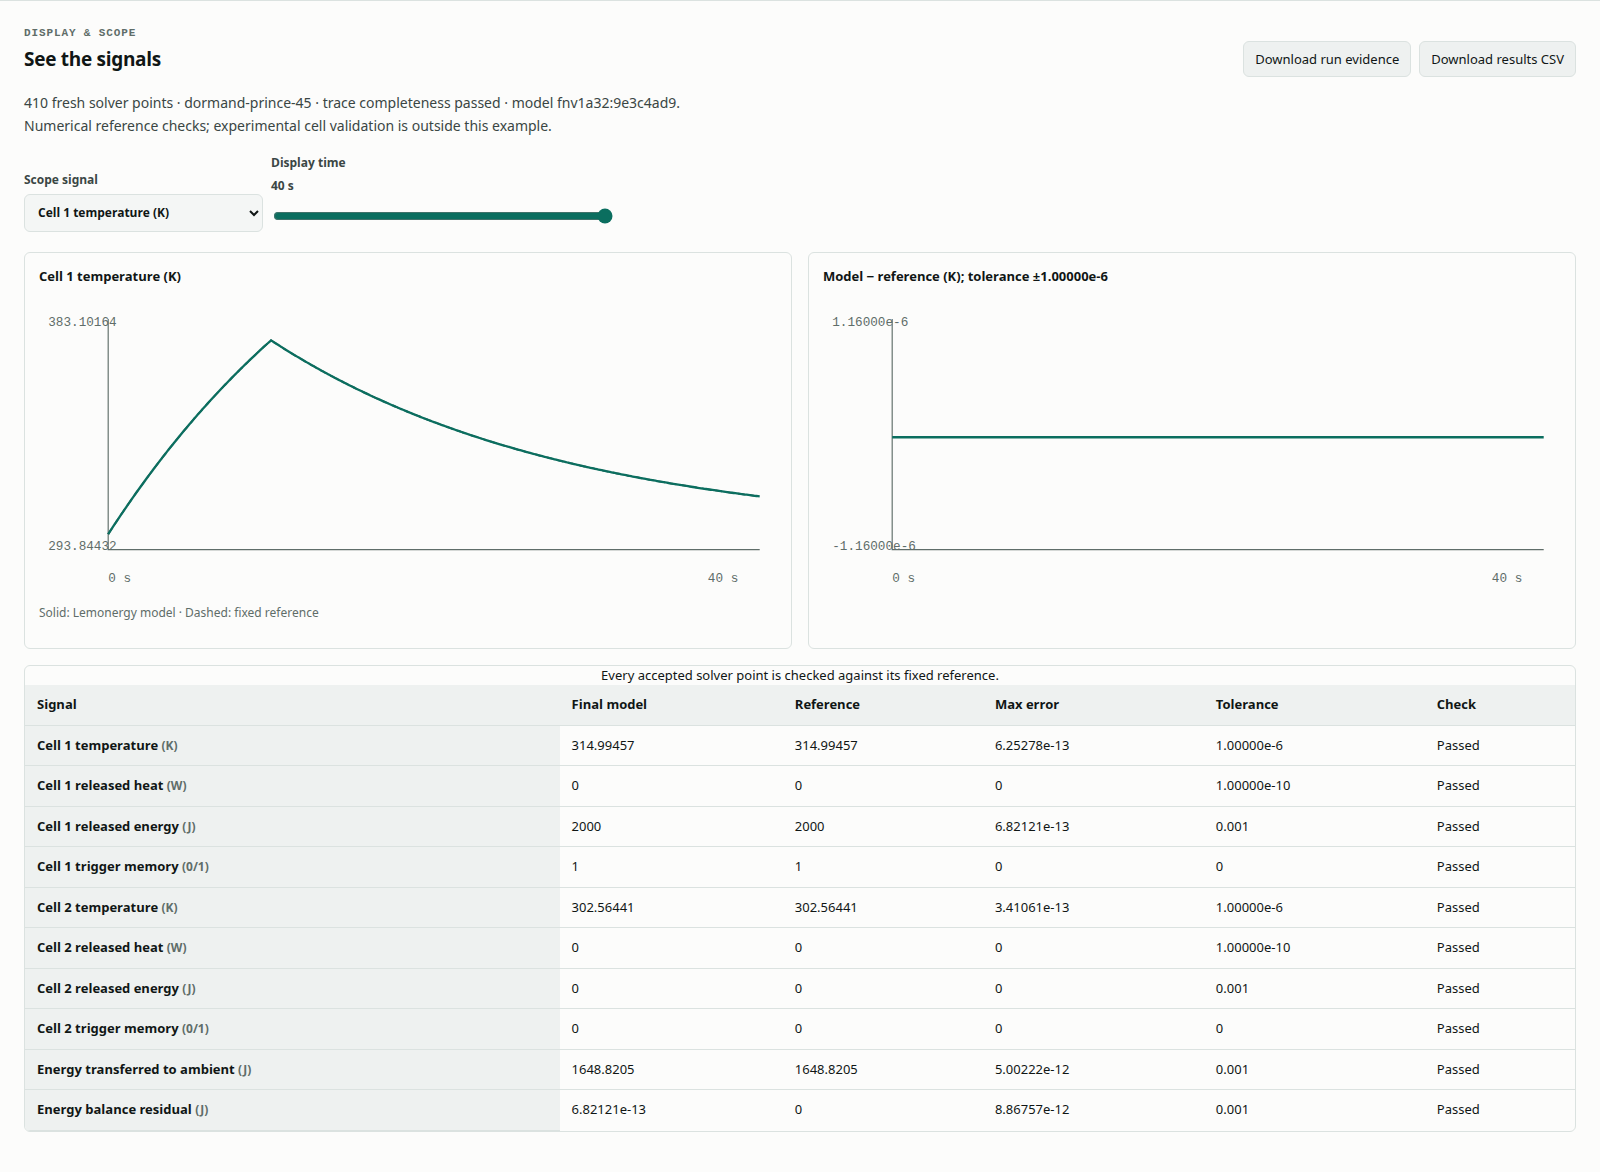
These rounded analytical checkpoints help interpret the plot. Cell 2 remains below its threshold through the complete 40 s verification window. Its modest rise continues after cell 1 stops releasing heat because the warmer first cell is still transferring heat to it.
| Time (s) | T1 (K) | T2 (K) | P1 (W) | P2 (W) |
|---|---|---|---|---|
| 0 | 300.000000 | 300.000000 | 200 | 0 |
| 5 | 343.718403 | 300.521440 | 200 | 0 |
| 10 | 376.945964 | 301.747904 | 0 | 0 |
| 20 | 344.499907 | 303.230337 | 0 | 0 |
| 40 | 314.994566 | 302.564410 | 0 | 0 |
At 10 s, cell 1 is about 376.95 K here, compared with 357.75 K in the stronger-link example. Less heat is carried away from the seeded cell. Reducing conduction therefore changes both the neighbor's exposure and the seeded cell's temperature; it is not an unconditional improvement in every output.
| Energy at 40 s | Expected value |
|---|---|
| Cell 1 release | 2,000 J |
| Cell 2 release | 0 J |
| Transfer to ambient | 1,648.820492 J |
| Combined stored-energy increase | 351.179508 J |
| Stored increase + ambient transfer − release | 0 J analytically |
The retained thermal report, generated 1 October 2026 at 18:52:33 UTC, passed with 410 output points and a maximum energy-balance residual of approximately 8.87e−12 J. That historical evidence is distinct from a new run shown in the software screenshots.
The fixed gates apply across the entire trace: 1e−6 K for temperature, 1e−10 W for release power, 1e−3 J for energy and exactly zero latch error. The original settings, complete time window, every accepted point and all 0.1 s sample instants must also be retained. A zero final latch by itself does not prove that the intermediate trace was checked; see read validation results.
Restore the stronger connection (Pro)
Choose Edit with Pro to open this example in the authenticated Design editor. The following changes require Pro editing. Use Run blocks & compare there to solve the edited graph; the public prepared model stays unchanged.
Save this model, then edit Gain on inter-cell-heat from 0.1 to 2 and rerun. The neighboring trigger should appear at 9.7 s, its pulse should end at 19.7 s and total release should become 4,000 J. The edited run should fail against this reduced-coupling reference because its inputs have changed.
Load Two cells: triggered heat propagation for the matching stronger-link reference. Save both runs with their inputs and compare the temperature, pulse and energy traces. Restore the reference blocks before reporting a result for this page's original case.
Troubleshoot and assess the limits
| Observation | Check |
|---|---|
| Cell 2 triggers in the original reduced-coupling case | Inter-cell gain must be 0.1, threshold 320 K, ambient loss 1 W/K and initial temperatures 300 K |
| Cell 1 releases no heat | Seed at 0 s, seed comparison, latch input and zero reset |
| A second release branch appears unused | This is expected; keep it connected so the same model can test other coupling values |
| Cell 2 cools immediately from 300 K | Check the sign of the link heat and the initial temperatures |
| Residual changes after a Pro parameter edit | Match the Thermal balance C/H values to the stored-energy and ambient-heat gains |
| Comparison is cleared after a Pro edit | In the Pro editor, rerun to bind new evidence to the edited model |
No neighboring trigger through 40 s is a result for this prescribed synthetic setup. It does not establish a physical barrier, safety margin or certification result. Heat release is rectangular, properties are constant, temperature is uniform within each cell and the trigger is sampled. Reaction kinetics, gas, flame, radiation, venting, ejecta, electrochemistry and spatial gradients are not represented.
References and related reading
The retained thermal evidence preserves this case's historical inputs and full-trace check. External architecture documentation listed among the sources is background rather than measured validation; MATLAB/Simscape was not executed for that retained evidence. Continue with thermal propagation verification, battery thermal management and the worked-example library.